Space Weather and Solar Flare Forecasting
These pages contain general information about space weather and its effects on Earth outlining the context in which the FLARECAST forecasting system is being developed. Solar flares are not the only phenomena responsible for solar activity, and there are significant differences both in their workings and effects compared to other phenomena such as coronal mass ejections, filament eruptions or fast wind flowing out of coronal holes. A section thus describes what solar flares are, where and when they occur and what may happen after a big flare. The next section summarises how flares have been observed in the past, how they are presently forecasted and the approach taken by the FLARECAST project to automatise solar flare forecasting. A list of current space weather prediction centres complements the information, aiming at positioning solar flare forecasting within the bigger picture of space weather prediction – a field that may be characterized by ‘work-in-progress’, as more research is needed at various levels.
- What is space weather?
- What are solar flares?
- How we forecast solar flares
- Space weather prediction centres
What is space weather?
Weather in space can be quiet or agitated just like weather on Earth. There are winds, clouds, and storms. However, they are very different from those on Earth. In space, winds, clouds, and storms don’t consist of air and water droplets, but of tiny, super-fast charged particles, plasma (matter hotter than gas), and magnetic fields. They come from the Sun and spread out through the solar system in spiral-shaped waves.
Space weather visualization, credit: Martin Törnros, interactivarum, as part of project OpenSpace
THE SUN PRODUCES WEATHER CONDITIONS IN SPACE
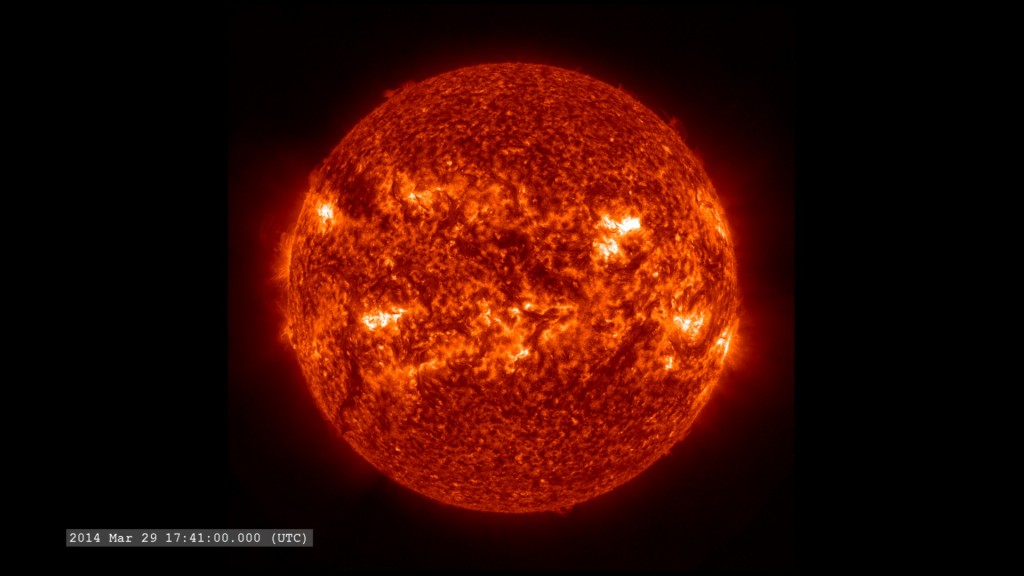
Even in its quiet phase, the Sun constantly releases a stream of charged particles – the solar wind. It travels through space at speeds of about 400 km per second. When the Sun is more active and the magnetic fields on its surface become too stressed, they release their energy in a spectacular eruption – a flare. Observe the bustling and bubbling around these active regions in the movie below. It’s as if you were flying across the solar surface over five days in two minutes. From time to time, you see a short bright flash – that’s a small flare.
Solar activity movie. Credit: Eric Buchlin; data: SDO/AIA from the Medoc Data Center.
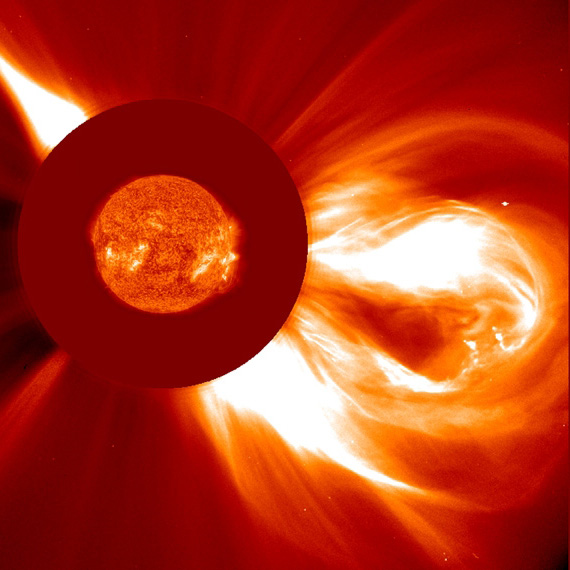
A big flare can blast off millions of tons of charged particles into space. The solar wind turns into a solar storm, reaching up to 1000 km per second and impacting any planet or spacecraft in its path.
Watch a solar storm spreading throught the solar system in the 25-second animation below.
Solar storm animation. Credit: NASA/Goddard Space Flight Center/CI Lab.
ON EARTH WE DON’T NOTICE THE SOLAR WIND
Low or moderate solar activity doesn’t affect us. Fortunately, the magnetic bubble around our planet bounces the solar wind off. Some solar particles may enter the atmosphere near the poles where the magnetic field lined enter the Earth. They trigger the beautiful aurorae (polar lights).
The three-minute movie below takes us on a space weather journey from the center of the Sun, to solar eruptions in the Sun’s atmosphere, all the way to the effects of that activity near Earth.
Space weather animation. Credit: NASA/Goddard Space Flight Center/CI Lab.
When solar activity is strong and Earth directed, space weather disturbences may occur:
A radio blackout occurs when X-rays released during a solar flare interact with the Earth’s atmoshpere, blocking radio signals. This affects long-distance, high-frequency radio communication. Radio blackouts start eight minutes after an Earth-directed solar flare and may last from a few seconds to a few hours in extreme cases.
A solar radiation storm occurs when a solar flare accelerates charged particles in the solar atmosphere to very high velocities. Arriving at the Earth in just 30 minutes in some cases, they penetrate the magnetosphere and move along the magnetic field lines near the poles. When exposed to a solar radiation storm, technology, and human health may be damaged.
A geomagnetic storm is caused by a fast solar wind or a solar storm interacting with the Earth’s magnetosphere. Reaching the Earth in about 2 – 3 days, it produces beautiful polar lights. However, it can also disrupt navigation systems such as GPS and induce currents in power grids and pipelines.
For more information about environmental disturbances caused by solar activity see the NOAA Space Weather Scales.
HOW DANGEROUS IS SPACE WEATHER?
Here on Earth we are safe, protected by the Earth’s natural magnetic field. Out in space, though, that’s another matter. Scientists know that when they see the light of an X-ray explosion on the Sun, astronauts can have as little as 20 minutes to get to safety into their spacecraft before the extremely fast high-energy particles arrive. Until recently, the effects of solar activity on the Earth weren’t considered a threat. In the 21st century, we have become more vulnerable due to the technologies our societies depend on. Should a very strong solar storm hit the Earth, it may not only cause damage to space-based technology but also to communication systems, transportation networks, pipelines, and power grids on Earth.
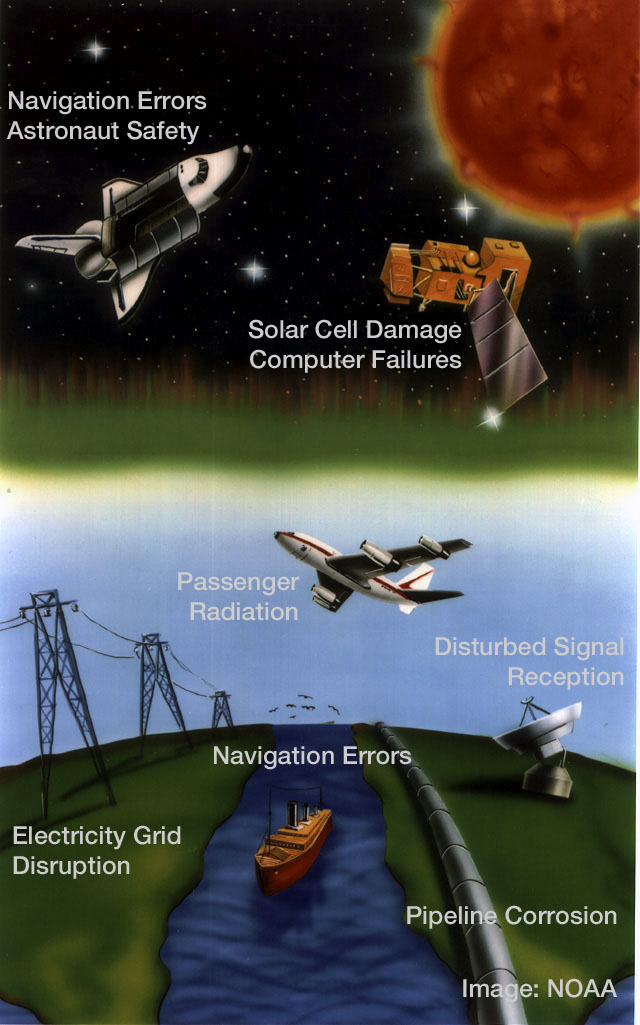 Impacts of space weather. Credit: NOAA.
Some governments have started to develop strategies for protecting infrastructures, technology, and human health from damage in the case of a severe space weather event. For example, in a draft document describing their national space weather strategy, the US government describes the following goals:
1. Establish Benchmarks for Space Weather Events
2. Enhance Response and Recovery Capabilities
3. Improve Protection and Mitigation Efforts
4. Improve Assessment, Modeling, and Prediction of Impacts on Critical Infrastructure
5. Improve Space Weather Services through Advancing Understanding and Forecasting
6. Increase International Cooperation
Source: http://www.swpc.noaa.gov/news/national-space-weather-strategy-released-public-comment, retrieved May 19, 2015
FLARECAST will contribute to these goals by developing a new flare forecasting system, and increasing knowledge about solar flares.
More about space weather at the MET Office Space Weather Operations Centre and the NOAA Space Weather Prediction Center webpages.
What are solar flares?
Are these flares?
-
- This is not a flare. It is a Coronal Mass Ejection CME spreading out into space.
-
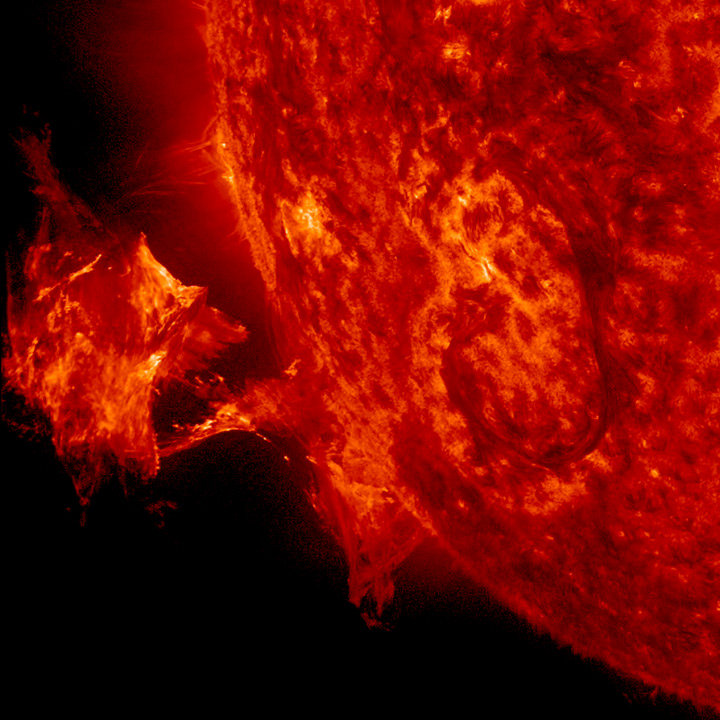
- This is not a flare. It is a plasma eruption.
-
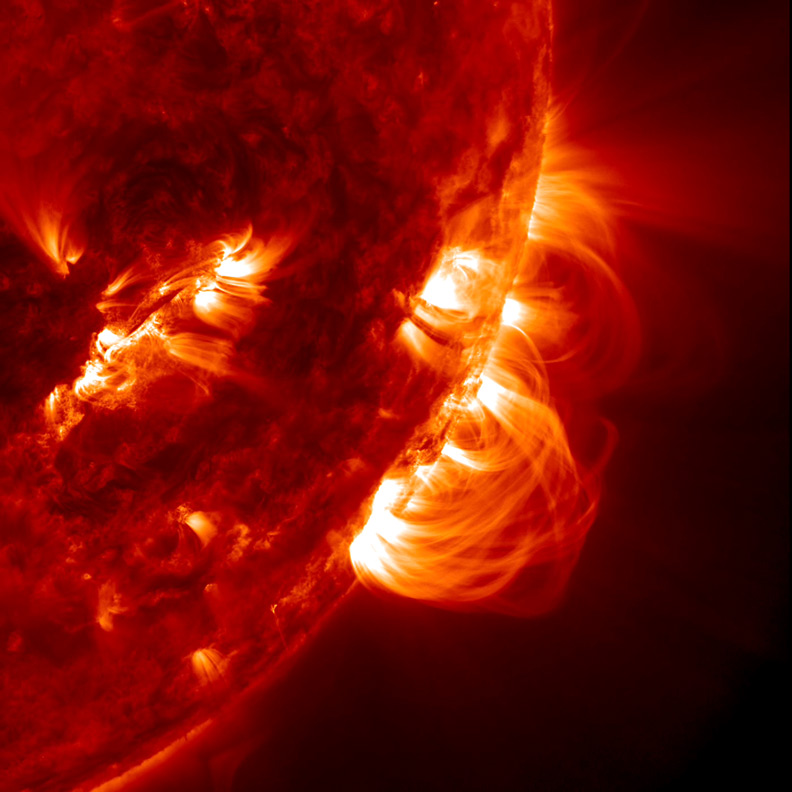
- These are not flares but magnetic loops.
-
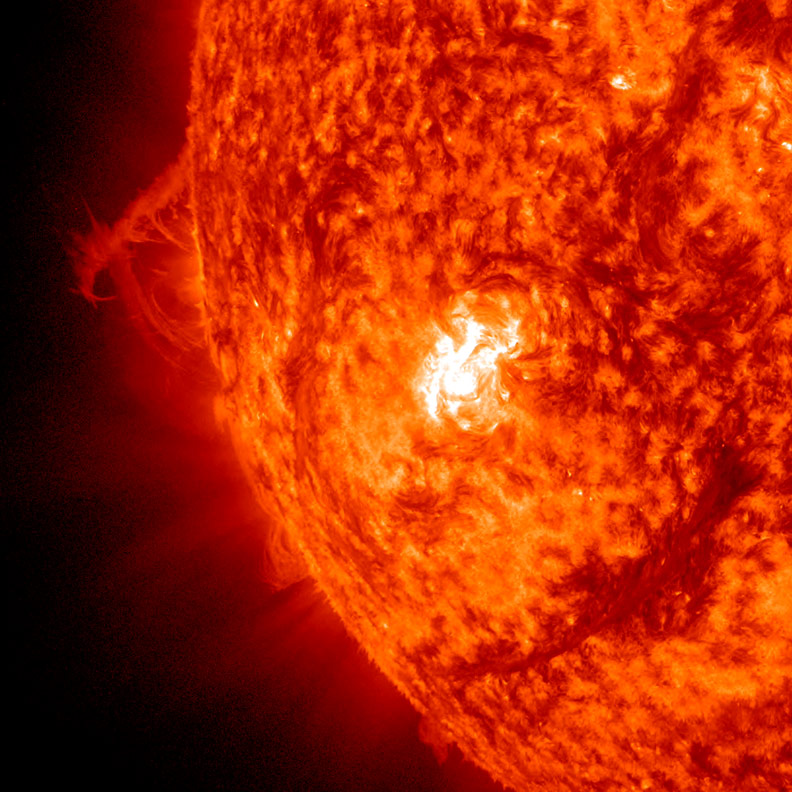
- This flash of brightness is a flare! A huge amount of energy is released.
A FULL DISK VIEW OF A FLARE
Click on the image to observe three hours in just 30 seconds. Keep an eye on the top right quadrant and be patient! The flare happens at the end of the movie.
Credit: NASA SVS/SDO
WHAT HAPPENS AFTER A SOLAR FLARE?
A flare affects all layers of the solar atmosphere.
- The plasma (matter hotter than gas) in the solar atmosphere is heated to millions of degrees C°.
- Electrons, protons and ions are accelerated to near the speed of light.
- The charged particles produce radiation in all wavelengths of the electromagnetic spectrum, from radio waves to X- and gamma-rays.
A flare may cause space weather phenomena near the Earth
Radio blackouts: Light will from the flare will reach the Earth as soon as 8 minutes. X-rays and extreme ultraviolet light from solar flares ionise the Earth’s atmosphere, which can block radio signals in the enhanced dayside (Sun facing) area of the upper atmosphere.
Solar radiation storms: It takes only about twenty minutes until the high energy radiation released during a big flare reaches the Earth. It may cause a solar radiation storm in our planet’s atmosphere. The charged particles may interrupt radio transmissions and disturb satellite operations. They are a hazard for astronauts and crew/passengers of high-altitude aircrafts.
Geomagnetic storms: A flare (not every flare!) may produce a Coronal Mass Ejection (CME) blasting off millions of tons of matter into space. It takes two to four days until a CME reaches the Earth. The solar storm may cause a geomagnetic storm, disturbing the magnetic fields around the Earth. While geomagnetic storms produce beautiful auroras, they also can disrupt navigation systems such as the Global Navigation Satellite System (GNSS) and create harmful geomagnetic induced currents (GICs) in the power grid and pipelines.
WHERE DO SOLAR FLARES OCCUR?
You need to look at active regions near sunspots. However, not every sunspot produces a flare. Bigger, more complex regions with a history of flaring are generally thought more likely to flare.
Sunspots can be observed from the Earth with a simple telescope. Yet, for observing solar activity, we need a UV instrument such as the one on board the satellite Solar Dynamic Observatory. Using this we can see magnetic loops, in which huge amounts of energy is trapped. Once a magnetic loop bursts, the energy is released in the form of a solar eruption.
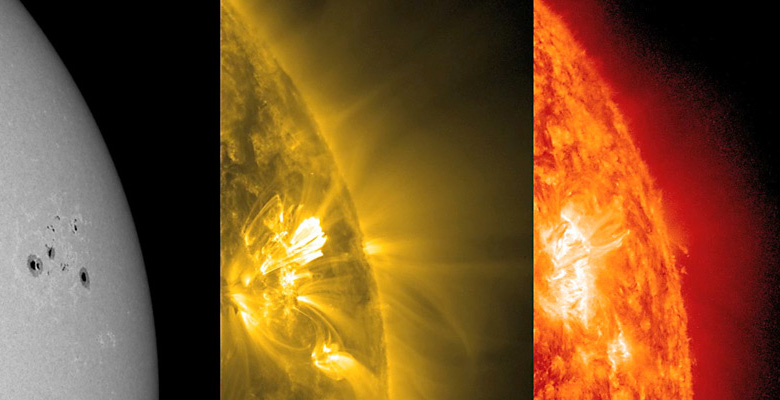
Active region with sunspots in visible light and in two different wavelengths of extreme ultraviolet light. Credit: NASA/SDO
WHEN DO SOLAR FLARES HAPPEN?
Tiny flares may occur throughout the eleven years solar cycle.
The active phase of the solar cycle generally sees more solar eruptions, however big flares triggering space weather events can occur at any time during the cycle. After a peak in 2012 and in 2014, solar activity is currently declining with the minimum expected in the early 2020s.
Please check the NOAA Space Weather Prediction Center for the latest update of the current solar cycle.
More about solar flares at Solar Flare Theory Educational Web Pages
Any questions about solar flares? Ask us.
How we forecast solar flares: past, present and future
OBSERVING FLARES IN THE PAST
Sunspots were observed on a regular basis since the early 17th century. Galileo Galilei’s sunspot drawings are some of the best known observations of that time.
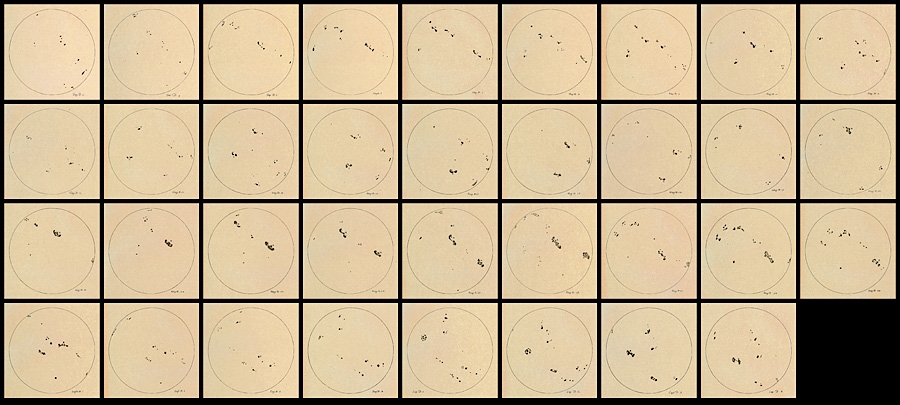
Sunspot drawings by Galileo Galilei, 1612. Images: Galileo Project, Rice University. Graphic: Bob Oakley
It took more that two centuries until the first observation of a solar flare was recorded.
Click here to learn more
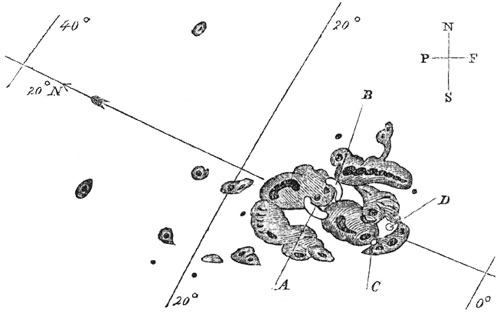
Sunspots of September 1, 1859, as sketched by Richard Carrington. A and B mark the initial positions of an intensely bright event, which moved over the course of five minutes to C and D before disappearing. Image retrieved on Wikipedia, July 2015. Original image: Royal Astronomical Society
In the morning after the observation, polar lights coloured the sky all over planet Earth even at near tropical latitudes over Cuba, Hawaii and Senegal. At the same time, telegraph systems worldwide broke down, producing frightening effects such as paper starting to burn or telegraph operators suffering electrical shocks.
For the first time, scientists suspected a connection between solar activity and auroras on Earth. However, there were very few occasions for observing the phenomenon. Forecasting it was completely impossible.
It took nearly another century until a new instrument, the radio telescope, lead to the discovery of radio bursts, a phenomena apparently related to solar flares.
SOLAR FLARE PREDICTION TODAY
In the 1970s, when it became possible to send instruments to space and observe the Sun in wavelengths that don’t penetrate our planet’s atmosphere, a new area of solar research began. X-ray instruments were not only able to detect flares but also to measure their magnitude.
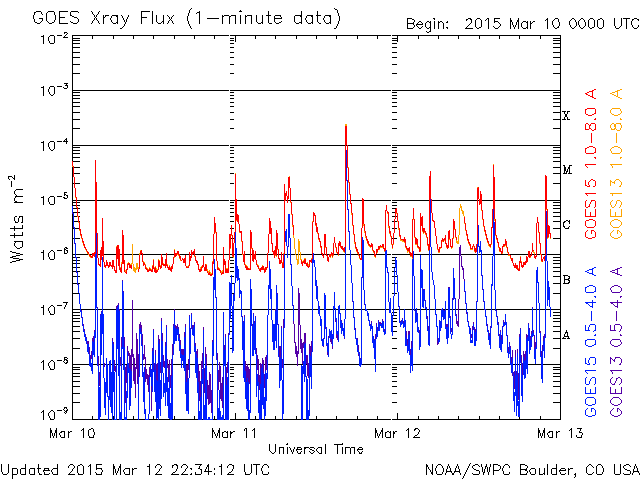
High solar activity in March 2015. The X-flare of March 11 was one of the biggest of solar cycle 24.. Click on the image for the current x-ray plot.
Classifying flares
Flares are classified as A-, B-, C-, M-, or X- based on their peak soft X-ray flux in the 1-8Angstrom channel measured by the GOES spacecraft. Operational space weather forecasting centres will be looking out for M- and X- class flares, as these can cause significant space weather events such as radio blackouts.
Classifying active regions
Today, space based solar observatories such as the Solar Dynamic Observatory (SDO) carry several instruments covering a wide range of wavelengths of solar emissions. The most spectacular observations are those in ultraviolet light, revealing incredible details of solar activity.
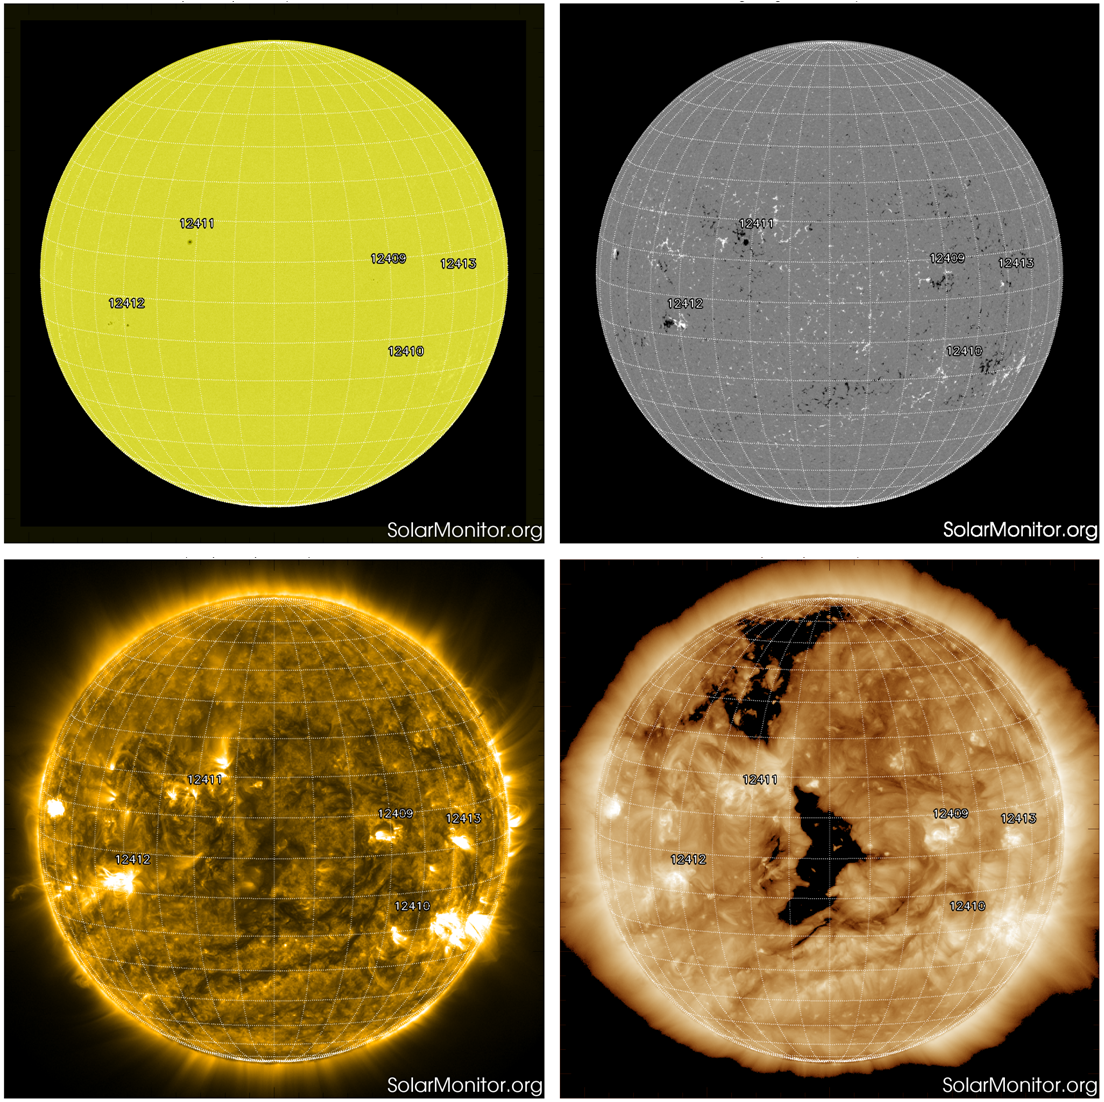
Images showing white light (top left), magnetic field (top right), EUV 171Angstrom (bottom left), and EUV 193Angstrom (bottom right), as captured by the SDO spacecraft. Source: solarmonitor.org
It is the magnetogram that is most useful for modern-day flare forecasting, which is simply an image where colour represents magnetic field strength. In the magnetogram shown in the figure above, white areas represent magnetic fields oriented toward the observer (positive field strength), and black areas represent represent magnetic fields oriented away from the observer (negative field strength).
For operational space weather centres (see examples below), the first step in forecasting a flare is to determine regions of interest from these SDO images. Forecasters will identify any features which are already having, or are likely to have, an impact on space weather conditions in the coming days. Notice in the images above that regions have been numbered according to the NOAA Space Weather Prediction Centre sunspot numbering scheme – when a new region emerges onto the solar disk it is given a number in order.
The next step is to classify the complexity of these identified active regions of interest. It is generally believed that active regions that are big, bad, and ugly are more likely to flare, i.e., they are large in size, have a history of flare activity, and are complex in nature. Quantifying this complexity is an important step in the flare forecasting process. Operational forecasters tend to use a standard sunspot group classification system which is commonly used as a ‘proxy’ for complexity.
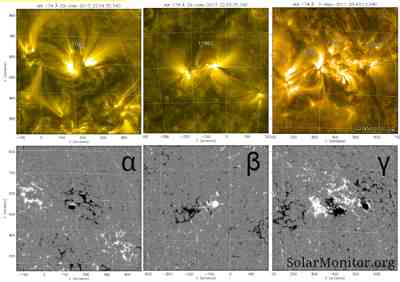
The top row of images shows the configuration of the magnetic field in the solar atmosphere above the sunspot groups; hot, bright gas is confined to magnetic loops, much like iron filings being confined to the magnetic field of a bar magnet. The bottom row shows the magnetic ‘footprint’ of the above magnetic structures. Source: sunspotter.org
Forecasters will sort the active regions into several classes, the most simple class being ‘alpha’: one polarity of magnetic field. Slightly more complex is ‘beta’: two polarities, or bipolar. A classification of ‘gamma’ is more complex, and indicates that the polarities are mixed together (i.e., essentially that a single, fairly straight line cannot divide the regions of white and black). There are other variations of these basic classifications, that are part of the ‘Hale’ or ‘Mt. Wilson’ classification scheme. Another widely used scheme is called the McIntosh system. These systems both rely on magnetograms as well as white light images of regions to make classifications. More complex properties can also be obtained from the magnetic field information of the regions, and used to obtain a flare forecast (see, e.g., Conlon et al, Georgoulis et al, Higgins et al, Leka et al).
Calculating flare probability
Once the active regions have been classified, the next step is to calculate the probability of a flare occurring in this region over the next 24 hours. There are many ways to do this, including Bayesian methods (e.g., Wheatland et al), machine learning (e.g, Qahwaji et al), discriminant analysis (e.g., Barnes et al), and many more. For operational flare forecasting a simple statistical method is often used, along with a little human intervention. Forecasters will first rely on a large database of flare information from previous solar cycles. This database shows how many particular classes of flares (i.e, how many M or X flares) an active region of that classification produced in that time period. From this an average flare rate can be calculated, and using Poisson statistics a percentage probability of flare occurrence for the next 24 hours will be obtained for each region. See Bloomfield et al, 2012 for a more in-depth description of this method. If an operational forecaster thinks the value determined by the model is too small or too big they can change it based on their experience before issuing it. The percentages for each region can also be added to obtain the probability of a flare occurring across the entire solar disk over the next 24 hours.
THE FUTURE OF SOLAR FLARE PREDICTION
In FLARECAST, we worked on a flare forecasting system that analyses active regions automatically and verifies the forecasts in near-real-time. Active region properties were extracted from solar magnetograms and white-light images in near-realtime using advanced image-processing techniques. Once these ‘complex’ properties were extracted, they were correlated with solar flare activity and used to optimize prediction algorithms based on statistical, unsupervised clustering and supervised learning methods. This enabled us to validate our image processing and flare prediction algorithms before launching the near-realtime flare forecasting service, the first of its kind in the world. See the Research section for more details on the project.
References
- Ahmed, O. W., Qahwaji, R., Colak, T., Higgins, P. A., Gallagher, P. T., and Bloomfield, D. S., Solar Flare Prediction Using Advanced Feature Extraction, Machine Learning, and Feature Selection, 2013, Solar Physics, 283, 1, 157-175, doi: 10.1007/s11207-011-9896-1.
- Barnes, G., Leka, K. D., Schumer, E. A., and Della-Rose, D. J., Probabilistic forecasting of solar flares from vector magnetogram data, Space Weather, 5, S09002, doi: 10.1029/2007SW000317.
- Bloomfield, D. S., Higgins, P. A., McAteer, R. T. J., and Gallagher, P. T., Toward Reliable Benchmarking of Solar Flare Forecasting Methods, 2012, Astrophysical Journal Letters, 747, 2, L41, doi: 10.1088/2041-8205/747/2/L41.
- Conlon, P. A., McAteer, R. T. J., Gallagher, P. T., and Fennell, L., Quantifying the Evolving Magnetic Structure of Active Regions, 2010, Astrophysical Journal, 722, 1, 577-585, doi: 10.1088/0004-637X/722/1/577.
- Georgoulis, M. K., and Rust, D. M., Quantitative Forecasting of Major Solar Flares, 2007, Astrophysical Journal, 661, 1, 109-112, doi: 10.1086/518718.
- Higgins, P. A., Gallagher, P. T., McAteer, R. T. J., and Bloomfield, D. S., Solar Magnetic Feature Detection and Tracking for Space Weather Monitoring, 2011, Advances in Space Research, 47, 12, 2105-2117, doi: 10.1016/j.asr.2010.06.024.
- Leka, K. D., and Barnes, G., Photospheric Magnetic Field Properties of Flaring versus Flare-quiet Active Regions. IV. A Statistically Significant Sample, 2007, Astrophysical Journal, 656, 2, 1173-1186, doi: 10.1086/510282.
- Wheatland, M., A statistical solar flare forecast method, 2005, Space Weather, 3, S07003, doi: 10.1029/2004SW000131.
Current prediction centres
Some examples of operational space weather forecasting centres are listed below.
- Australian Government Bureau of Meteorology
- Korean Space Weather Center
- Met Office Space Weather Operations Centre
- NOAA Space Weather Prediction Centre
- Solar Influences Data Center
The Met Office is one of the members of the FLARECAST consortium.
See also
- The Max Millenium message of the day provides a daily analysis and flare forecast service at http://solar.physics.montana.edu/max_millennium/mmmotd_latest/index.html. You can subscribe by entering your email address in the field MMmotd at http://solar.physics.montana.edu/max_millennium/mmlists.shtml.
- spaceweather.com gives interesting news items about current space weather conditions.
- Tamitha Skov’s YouTube forecasts.